How to debug node js app
When we run the application in node js its very important to know how to debug node js application. This chapter helps to how to debug node js application. And also exploring the debugging tools provided by chrome and visual studio code editor.

Debugging with chrome dev tools:
First, we will learn how to use the chrome inspect debugger tool. Follow the below steps:
Step 1:
Insert the debugger keyword in your application from where you want to start debugging your application
Step 2:
Run the command:
node inspect server
Now npm will start debugger listening on //127.0.0.1:9229. The port 9229 is default one that is been used for debugger listener.
Step 3:
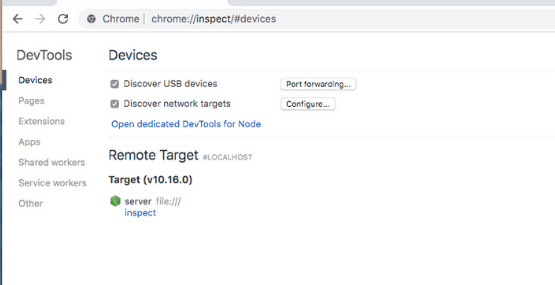
Open the Chrome browser
Hit the path : chrome://inspect
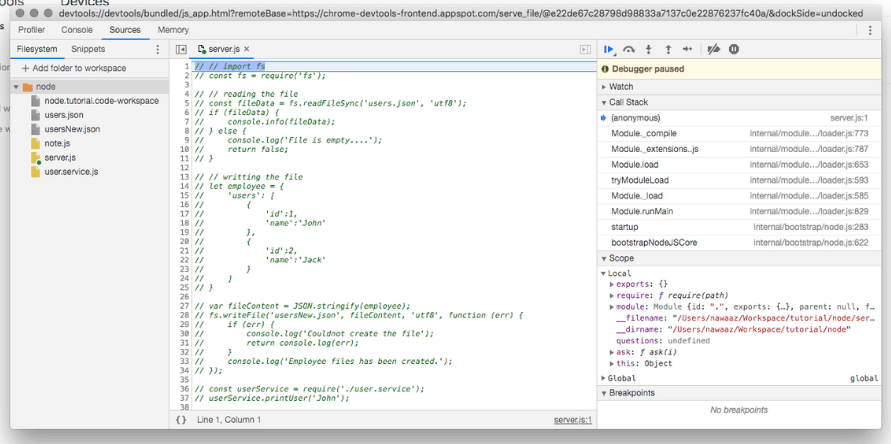
Now you will be able to see the dev tools that are available with chrome browser. Under the devices, there will be a remote target that shows the inspect link and click that link. This will open the new tab where it contains all the options. The pictures have been attached in the below
Debugging with visual studio code editor:
Step 1:
Go to the file that you want to start debugging.
Right-click on the line number you want to start and select add an inline breakpoint
Step 2:
Run the app or restart to see the breakpoints.
One thought on “How to debug node js app”
Comments are closed.